
Exclusive Research Partner:

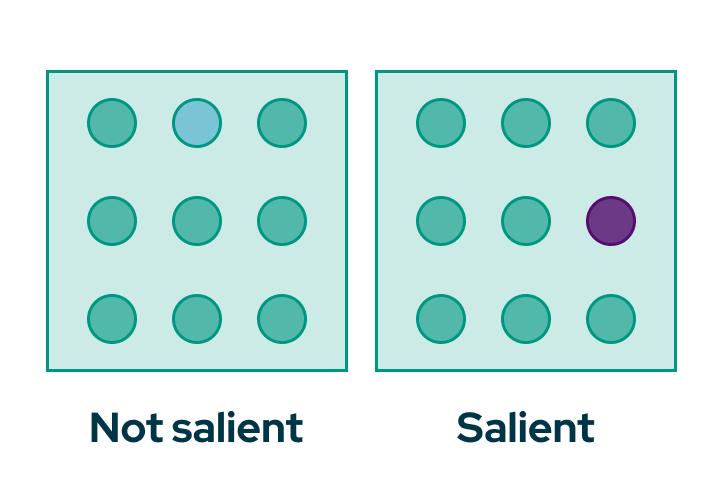
Thanks to the culmination of years of research and experience in the fields of Consumer Neuroscience and AI, we've been able to develop our own unique neural net that can predict visual salience (attention) with a remarkable accuracy of 95% relative to traditional eye tracking.
How does it work? Let's dive in.
The first step in our process is to gather visual saliency data from a large set of visual stimuli, such as advertisement images or video frames. This data is then exposed to a diverse group of real people in an online environment. By simulating eye-tracking, there is no need for this group to participate in a study with real eye-trackers.
Our network was trained on the attention data of thousands of participants. These participants together looked at more than 10,000 images. Each image was seen by at least 50 participants. This resulted in a training data set with a “gold truth” attention heatmap for each image.
The attention predictions on our platform are generated by an Artificial Neural Network (ANN). An ANN is a collection of nodes that are connected. Each connection has a weight determining how much one node impacts the next. The nodes are aggregated into layers.
An ANN is trained using a large set of training data. During training the weights of the network are updated. If trained correctly, it can transform any input into the correct output.

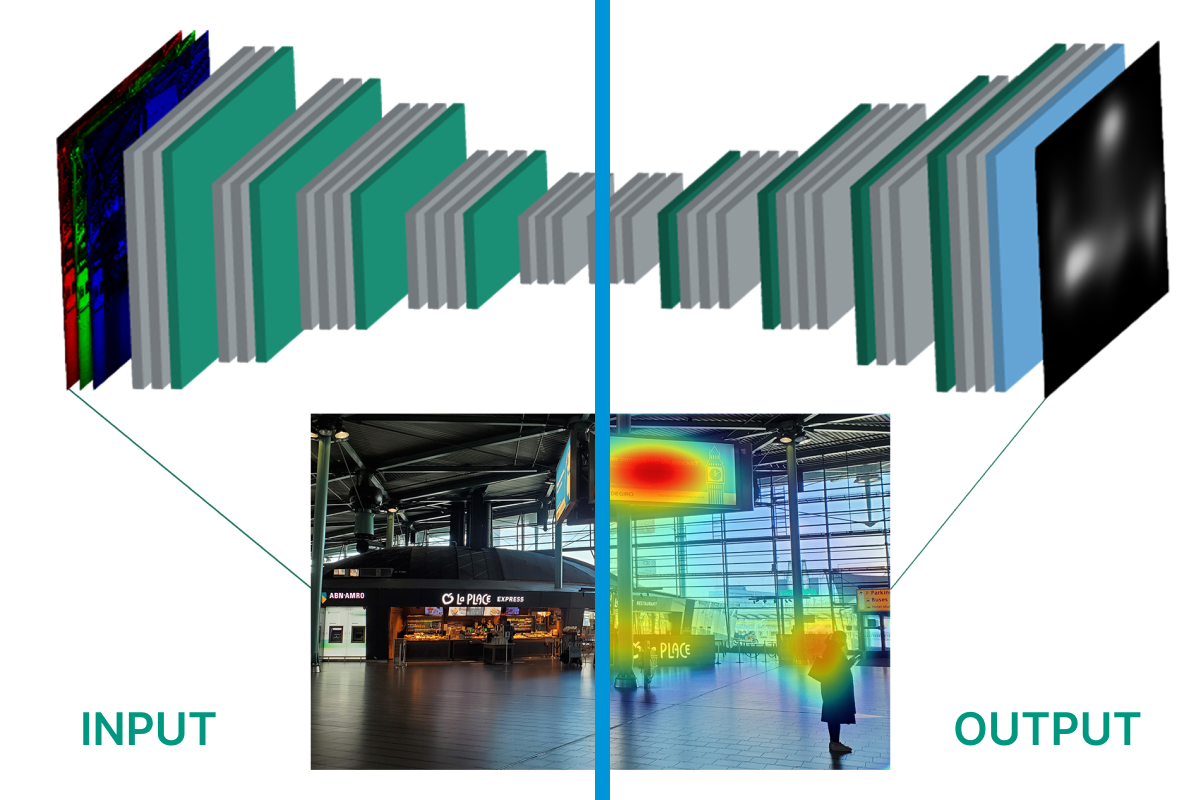
The above image visualises the connection of nodes in the neural network between the input and output layers
The attention prediction produced by expoze.io is generated using a so-called generative adversarial network, or GAN. The input is the RGB values of your image or video. The output is the attention prediction. On the input side a convolutional neural network, or ConvNet, is used that was pre-trained on over 14 million images to detect objects, and therefore it already holds a latent representation of object identity.
Before training, the GAN has random weights, resulting in faulty heatmaps. The difference between the predicted heatmap and the “gold truth” heatmap is the error. Mathematical procedures subsequently adjust the weights in a way that reduces this error.
After a large number of training rounds, the network converges to producing heatmaps that are more and more similar to the “gold truth”.
After gathering enough training data, the results are fed to an artificial neural network, using a specialized training scheme. After optimizing the neural net, it can simulate the saliency results gathered in the first step. Beyond that, the neural net can make accurate saliency predictions of visual material it has never seen before.
By following these steps:
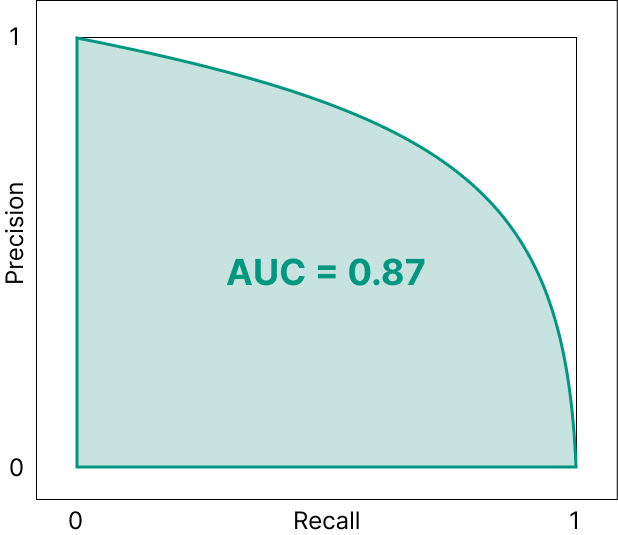
To measure the similarity between expoze.io predictions and real eye tracking we used the MIT/Tübingen saliency benchmark. We calculated the area under the curve score (AUC-Judd). A perfect match is 1.00.
Even eye tracking data from infinite participants doesn’t perfectly match data from a different set of infinite participants; the AUC score in that case is 0.92. The AUC score for expoze.io is only a little lower, 0.87, which is higher than many competing solutions. This means that, compared to the most optimal eye-tracking studies, our platform is 95% accurate!
Want to learn more? We go into more detail in our white paper below.
Exclusive Research Partner: